
Topic 1: Basics of Correlation
Correlation
The word correlation is used in everyday life to denote some form of association. However, in statistical terms, correlation denotes the association between two quantitative variables. In other words, correlation is the degree of the linear relationship between two or more continuous variables. The two variables are correlated if the change in one variable results in a corresponding change in the other variable.
There are two types of correlation such as,
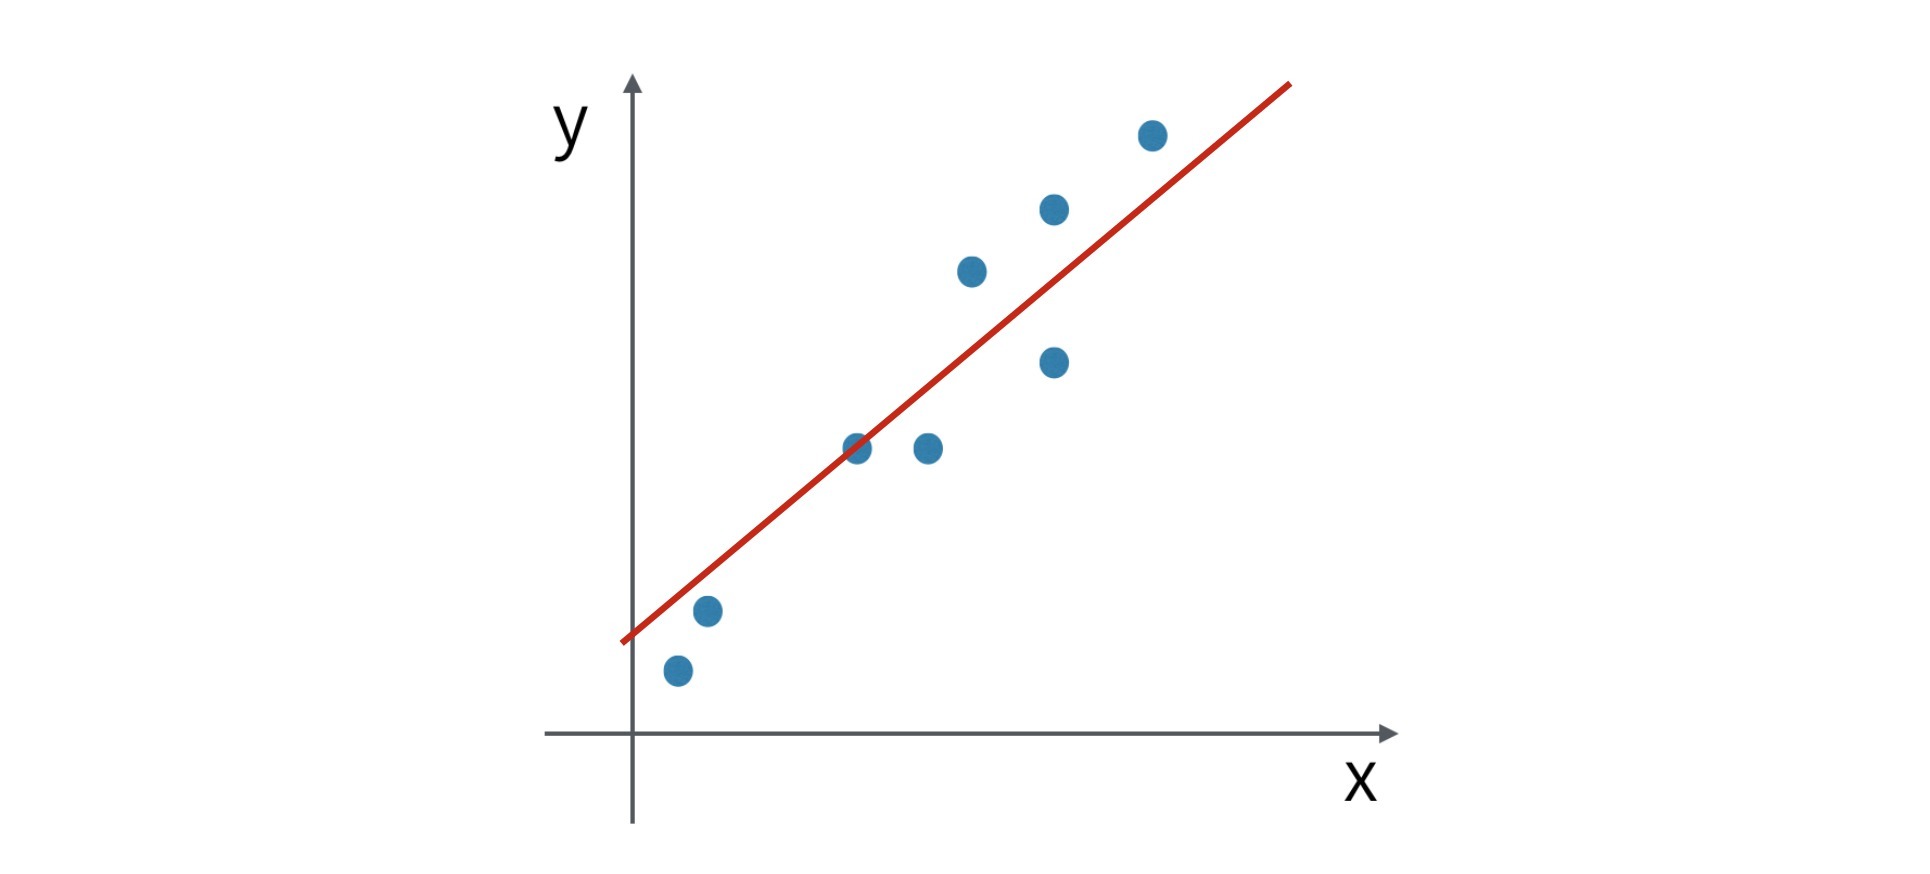
Positive correlation: variables varying together in the same direction, i.e. as the value of one variable increases, the value of the other variable increases and vice-versa.
Eg: Relationship between blood pressure and age (blood pressure increases with age).
Negative correlation: variables varying together in the opposite direction, i.e. as the value of one variable increases, the value of the other variable decreases and vice-versa.
Eg: Relationship between vital capacity and age (vital capacity decreases with age).
Methods of correlation analysis
The three important methods to study the correlation are,
1. Scatter Diagram Method
2. Karl Pearson's (Product Moment) coefficient of correlation
3. Spearman’s coefficient of rank correlation

Karl Pearson's product moment coefficient of correlation
Karl Pearson's product moment coefficient of correlation (notation ‘r’) is the parametric method to quantitatively measure the degree of relationship between two variables. Pearson’s correlation coefficient assumes that the population being studied is normally distributed with a linear relationship between the variables

Limitations of Pearson’s correlation coefficient
- Always assumes linear relationship
- If the relationship is curvilinear, ‘r’ will give false and misleading readings
- The variables being correlated must be measured on a continuous scale
- ‘r’ is affected by extreme observations
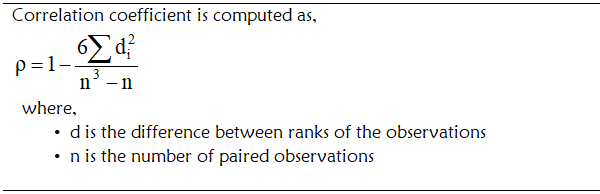
Spearman’s coefficient of rank correlation
Spearman’s coefficient of rank correlation [notation ‘ ’ (Rho) or ‘rs’] is the non-parametric method to quantitatively measure the degree of relationship between two variables.
Interpretation of correlation coefficient
‘r or rho' ranges from -1 to +1. The sign of the correlation coefficient (+,- ) indicates the direction of the relationship, either positive or negative. The magnitude of the correlation coefficient determines the strength of relationship between the variables. The various cut-off of the ‘r’ value and its interpretations are as follows,
Correlation value | Interpretation |
+1 | perfect positive correlation |
-1 | perfect negative correlation |
0.0 | no linear relationship |
0.00 to 0.29 | weak correlation |
0.30 to 0.69 | moderate correlation |
0.70 to 1.00 | high correlation |
..............................................................................................................................................
Reference: "Handbook on Biostatistics for Health Professionals, Karun M K and Amitha P, (2019), BCC publications"
..............................................................................................................................................